Data Analysis: South Yorkshire GP Practices & Deprivation
A large scale exploration of GP access and DNA (did not attend) rates across South Yorkshire, and the link these statistics have to rates of deprivation.
The Question
GP access is often discussed in terms of deprivation, but it’s not commonly explored at a local, practice by practice level. I wanted to test it properly for South Yorkshire, seeing if practices in more deprived areas see a different pattern of attendance, or different level of access compared to those in less deprived areas.
Data sources
This project combines four separate NHS/government datasets, joined together through a full SQL + Python pipeline:
- Appointments in General Practice (NHS England) Monthly, practice-level appointment records, including status, mode, and time between booking and appointment. Downloaded from digital.nhs.uk .
- Patients Registered at a GP Practice (NHS England) Practice-level patient list sizes and postcodes, used to convert raw appointment counts into an appointments per 1,000 patients rate digital.nhs.uk .
- English Indices of Deprivation 2025 (Ministry of Housing, Communities & Local Government) LSOA-level deprivation deciles, the current release as of October 2025. Downloaded from gov.uk
- ONS Postcode Directory (ONSPD), November 2025 (Office for National Statistics) Used to join GP practice postcodes to their LSOA, and from there to their deprivation decile. Downloaded from ONS Open Geography Portal
Data covers 169 GP practices across NHS South Yorkshire ICB (Barnsley, Doncaster, Rotherham, Sheffield sub-ICBs), for six months between November 2025 and May 2026 (March 2026 data was not published by NHS England and is excluded).
Methodology
- Filtered national appointment and patient-list publications down to South Yorkshire practices using sub-ICB location codes
- Built a SQLite database with practice-level appointment, patient list, and reference tables
- Joined practice postcodes to LSOA-level deprivation deciles via the ONS postcode directory
- Calculated appointments per 1,000 patients and DNA rate per practice, averaged across the six-month period
- Tested both metrics against deprivation decile using Spearman’s rank correlation (chosen over Pearson’s since IMD (Index of Multiple Deprivation) decile is an ordinal ranking, not a continuous scale)
- Built an interactive Power BI dashboard to visualise the results
Findings
| Metric | Spearman’s rho | p-value | Significant? |
|---|---|---|---|
| Appointments per 1,000 patients | -0.02 | 0.823 | No |
| DNA rate | -0.43 | < 0.001 | Yes |
Appointment volume showed no meaningful relationship with deprivation — practices in more and less deprived areas offer/deliver a broadly similar number of appointments per patient.
DNA (missed appointment) rate showed a moderate, statistically significant relationship — practices in more deprived areas see notably higher rates of missed appointments. This suggests deprivation in South Yorkshire may affect patients’ ability to attend booked appointments more than it affects the volume of care on offer. The reasons for this are talked about more in my blog post, but suggests bigger issues are things such as inflexibility at work and access to transport.
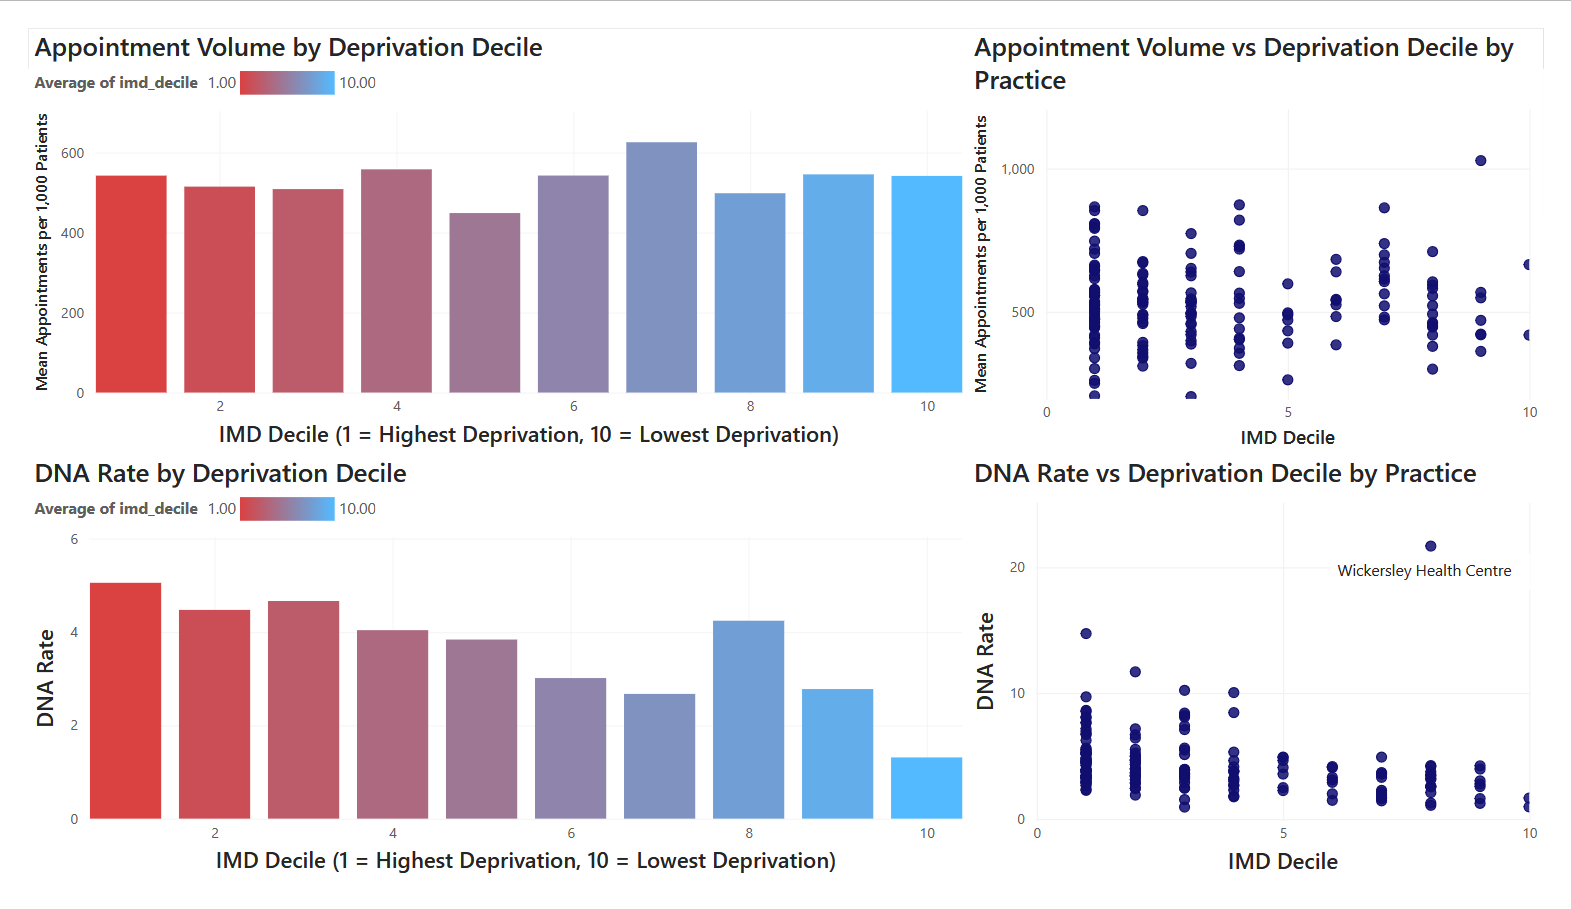 Power BI collection of visualisations
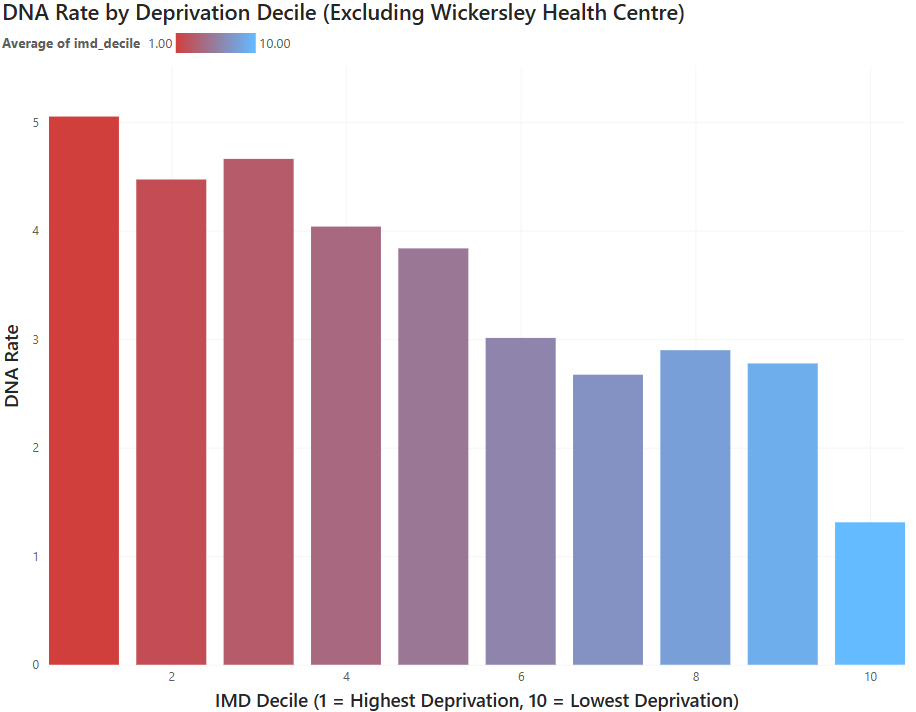
Power BI visualisation of DNA vs IMD Decile excluding the Wickersley outlier.
Limitations
- Patient list size was treated as a static snapshot (April 2026) across the whole period. I made this decision as changes in registered patient rates are negligible month to month.
- IMD 2025 uses a substantially revised methodology from the 2019 edition and is not directly comparable to older deprivation studies
- 169 practices share only 154 unique postcodes, as some operate from shared health centre sites
- One practice appeared twice in NHS reference data due to a mid-period clinical system migration, although this was dealt with during my SQL data cleaning process.
Downloads
📊 Short Power BI Report (.pdf)
🐍 Spearman Correlation Analysis (correlation.py)
🐍 Patient List Size Builder (build_patient_list_size.py)
🐍 Deprivation Table Builder (deprivationtable.py)
📁 Trimmed and Sorted Dataset (analysis_base.csv)
A full write-up discussing these findings in more depth is available on my blog .